Dashboards are customizable visual panels that present the indicators whose data can be extracted from PariPassu solutions and even from external sources.
You can create several dashboards, each with a specific purpose, bringing organized and easily identifiable information.
You also can customize the colors, sizes, and ordering of the indicators. Learn how to use this function now!
Check it out in this article:
How to create a Dashboard
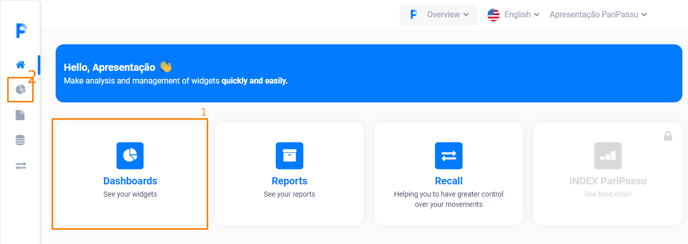
Step 1: Access your account through the link acesso.paripassu.com.br and enter your username and password to login. From your account initial screen, select the Panorama tool.
Step 2: Now on your Panorama's initial screen, select the "Dashboards" option in the central menu of your screen (1). You can also access them through the side menu in the left corner of your screen, just click on the icon  (2).
(2).
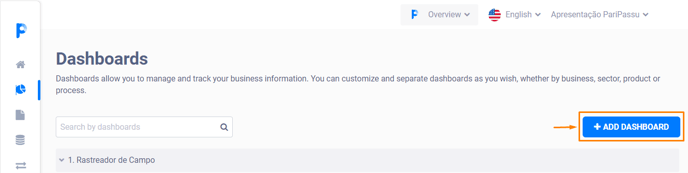
Step 3: On the Dashboards screen, click on the "Add Dashboard" button.
Step 4: The system will display the Add Dashboard screen, with different tabs. You must fill in all the fields on each tab to advance to the next one.
We explain the instructions for filling in each of the tabs bellow. To consult a specific one, just click on the one you need help with.
General tab
Report tab
PDF tab
Permissions tab
General:
This is the main configuration step. Depending on the options selected, you will already have a dashboard ready after completing it.
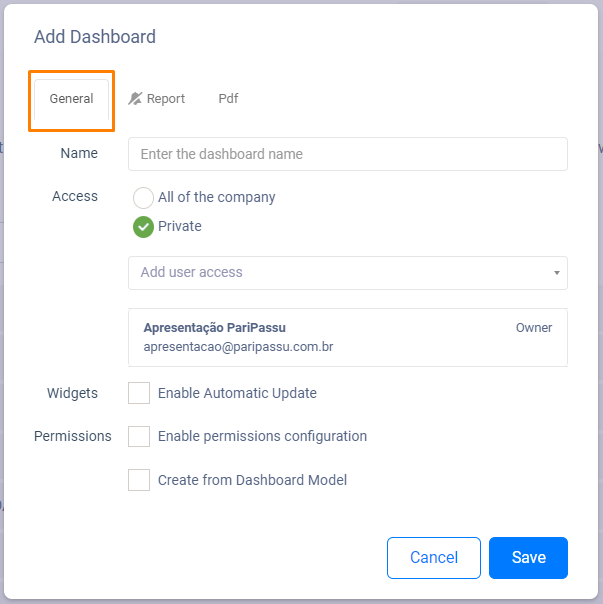
Step 1: Start by identifying your new dashboard in the Name field.
Step 2: In the Access option, you will define who can access the dashboard. The "Everyone in the company" field will make the dashboard available to all system users who access the platform with your company's email address. The "Private" field will maintain access only to specific users.
If you are working with confidential information and choose to create a private dashboard, you will need to select the users who will be able to access it. To do this, go to the Add user access field and click on the icon ![]() . Locate the desired username in the listing and click to select it. You can type part of the name into the search field to speed up the selection process.
. Locate the desired username in the listing and click to select it. You can type part of the name into the search field to speed up the selection process.
It is possible to select several users, just repeat the search process and click on the desired name. To delete one of the selected users, just click on the delete button ![]() .
.
After defining the name and access permission, you can now click "Save" and access your newly created dashboard. The report and PDF settings can be set up later, by editing the dashboard.
However, there are other configuration possibilities that you can perform at this time. Check it out below.
Step 3: At the bottom of the "Add Dashboards" screen, you will find some options that may or may not be checked, according to your needs. Check out what each of them represents in the box below:
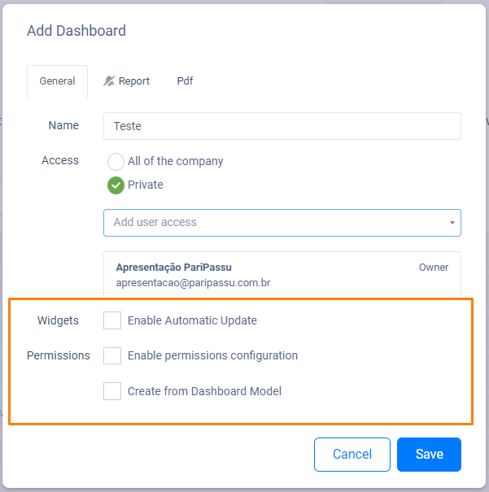
- Enable Automatic Update: Check this field if you need your indicators to be updated every time the dashboard is accessed.
- Enable Permissions Configuration: Check this field to define that only users selected by you will be able to edit the dashboard. When checking this option, the system will display the Permissions tab.
- Create from Dashboard Model: Check this field to select one of the dashboards with indicators already configured indicators. There are several models based on the other PariPassu systems. If you select this option, the system will open a field below, for you to select the model you want.
If you choose to create a dashboard without using the system's templates, you will need to insert indicators to monitor them.
If you have questions on how to add the indicators, check out our article with instructions:
How to add indicators in dashboards?
It's done! Now your dashboard is basically configured. Then, follow the instructions for completing the other tabs.
Report
Dashboards allow you to generate reports on the indicators that you have included. Check out the step-by-step guide for configuring the system to send reports automatically.
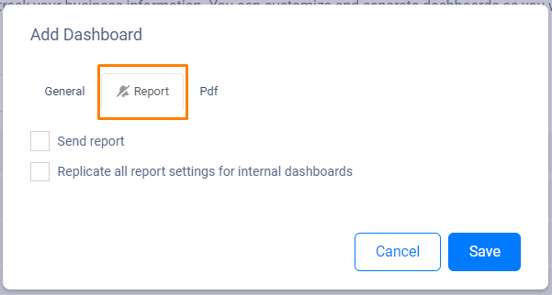
Step 1: You must check the "Send report" field. By checking it, the system will display new configuration options, as shown in the following image.
If you check the "Replicate all settings" field, all internal (grouped) dashboards will have the same sending characteristics, such as periodicity and destinations.
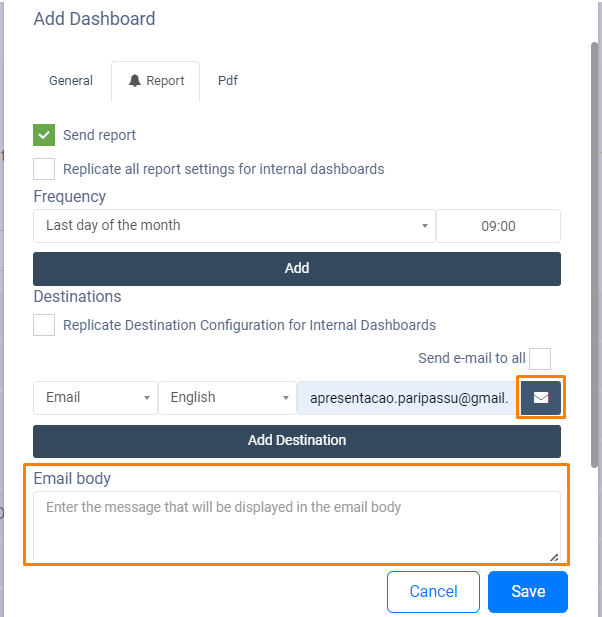
Step 2: You must set the Periodicity. In the first selection field, click on the icon ![]() to select the sending frequency you want: daily, weekly or monthly.
to select the sending frequency you want: daily, weekly or monthly.
In the second periodicity field, enter the time at which the report should be sent. The field must always be filled with four numeric characters. It is not necessary to include the dots.
You can include several sending periods, just click on "Add periodicity" and repeat the process. To exclude a period, just click on the button ![]() .
.
Step 3: Now it's time to define the Report Destinations.
- In the first field, click on the icon
 to select sending by email or by phone (SMS message).
 - In the second destination field, you can define in which language the report will be sent. Click on the icon to choose between Portuguese, English or Spanish.
- In the third field, inform the e-mail address or cell phone number, according to the selected destination option. If you choose send the report by cell phone, enter only numbers in this field, including area code.
You can also include as many recipients as necessary, just click on "Add destination" and repeat the process. To delete a addressee, just click on the button ![]() .
.
Whenever you add an email contact, the system will display the button ![]() next to the entered address. If necessary, you can click on it to disable sending the report to a specific address. This can be useful for you in cases where target settings are replicated to grouped dashboards.
next to the entered address. If necessary, you can click on it to disable sending the report to a specific address. This can be useful for you in cases where target settings are replicated to grouped dashboards.
For easy setup, you can check the "Send email to everyone" field. This way, all users with access to the dashboard will receive an email with the report.
Step 4: Finally, in the Email Body field, you can enter a default message that will be replicated in report submission messages.
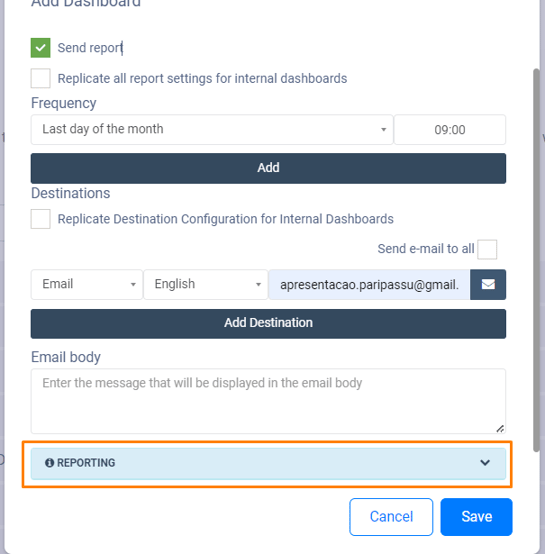
If you have any questions about submitting reports, click on the blue information bar at the bottom of the "Add Dashboards" screen. In it you will find an explanation about the data update and the times defined in the periodicity.
Step 5: Finally, click "Save" or continue making the settings in the PDF tab.
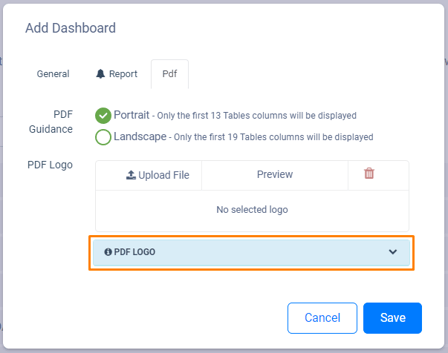
On this tab, you can configure the PDF format in which the reports will be generated.
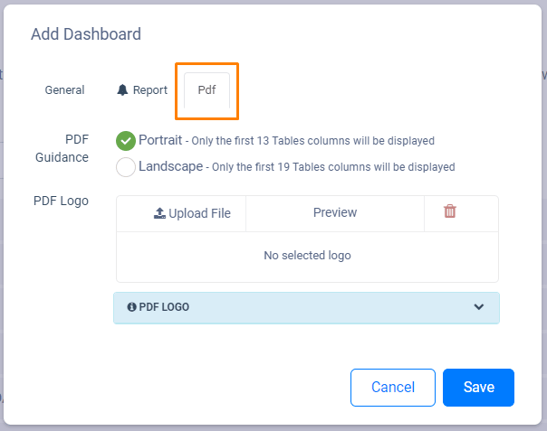
Step 1: In the PDF Orientation field, you must choose whether you want the file to be generated vertically or horizontally. Check the "Portrait" field, so that the pages are in vertical position, or check the "Landscape" field for pages in the horizontal position.
Step 2: In the PDF Logo field, you can select an image that will be displayed in the heading of reports, only for the dashboard being created. At this moment, you can select your company's logo, for example, to make the report even more personalized.
To do so, click on the "Choose file" button and locate the desired image on your computer. After selecting it, a thumbnail will be displayed for preview. If necessary, click the button ![]() to delete the selected image.
to delete the selected image.
If you have any questions about the logo, you can click on the blue information bar. There you will find the image format requirements. The file must have a minimum height of 145 pixels and must be in the PNG format.
Step 3: At last, click "Save".
There is an option called "Company Configuration" in the menu located in the top right corner of Panorama, next to your username. It also allows inserting an image for the PDF header of the reports. By inserting the logo using this button, the configuration will be applied to all dashboards and the setting made on the PDF tab will be disregarded.
Inserting a logo is not mandatory.
If you chose to "enable the permissions" configuration, on the General tab, you will need to make the settings on the Permissions tab.
Permissions
Whenever you enable the permissions setting on the General tab, you will need to select users on the Permissions tab.
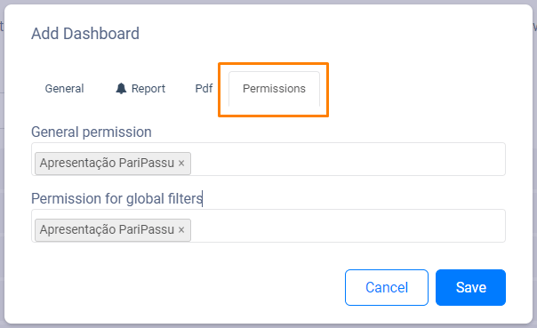
Step 1: Click on the General Permission field so that the system displays the list of users and then click again on each of the names you want to include. All users selected in this field will be able to edit general dashboard information.
Step 2: Click in the Permission for Global Filters field and select the users who will be able to create global filters for the dashboard. Global filters are applied to all included indicators.
Step 3: After including all the desired users, click "Save". In this way, your dashboard will have all the main configurations done!
We hope this article has helped you! 🍎
If you have any questions, CLICK HERE to contact our Customer Success team! We will be happy to assist you! 🤗💙
To the next! 🖐️