Panorama has several indicators that are pre-configured to analyze data extracted from other PariPassu solutions, but you can create indicators as you wish, according to your business needs.
Before creating an indicator (widget), think strategically about the information you want to obtain in order to best combine the data.
Check it out in this article:
How to add indicators?
Step 1: Access your account via the link acesso.paripassu.com.br and enter your username and password to login. From your account home screen, select the Panorama tool.
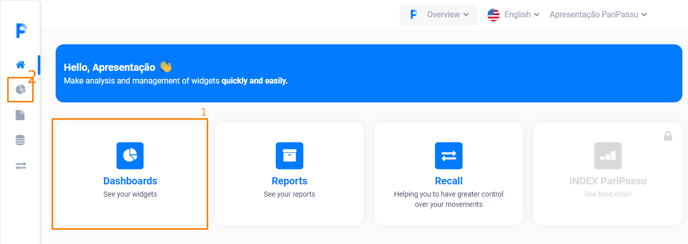
Step 2: On your Panorama's home screen, select the "Dashboards" option in the central menu of your screen (1). You can also access them through the side menu in the left side of your screen, just click on the icon  (2).
(2).
Step 3: The system will open a list with all your dashboards, select the one you want. Already inside the selected dashboard, click on the "New widget" button and select one of the two types of indicator: graphic or text.
Below are instructions for adding a graphic and then for adding a text indicator.
Adding a graphic indicator
The first thing you need to do is look at the image below. Note that adding indicators has three configuration steps: data configuration, graphic configuration and preview.
Attention: Data sources are made available according to your access permissions.
Stage 1 - Data Configuration:
Step 1: Identify your indicator in the Name field.
Step 2: In the Data Source field, select the solution from which you want to extract information for your indicator.
 |
It presents information related to production, such as data on harvesting, fertilization and pesticides. |
 |
It presents data obtained from different extraction sources, such as data obtained from inspections, related to questionnaires, assessments and action plans. |
 |
Shows data from tracking ratings made by consumers. |
 |
Enables the selection of data from external sources (such as an Excel spreadsheet, for example). It also allows you to use another already configured indicator or even do data union, combining different sources. To use external sources or join data it is necessary to create these options in the Data Source menu. |
 |
It presents information related to all functionalities from Rastreador PariPassu, such as data on traceability, production, purchase, sale, stock, suppliers and customers. |
 |
It presents data from the Analysis Results Monitoring System (S.A.R.A.), based on the results of analyzes carried out on products. |
Access to fonts is enabled by configuration. If any of the sources you need are disabled, contact the PariPassu Customer Success team.
Step 3: After selecting the source, you will have to define filters. This step is essential to determine the data that will be presented in the indicator. The display of filtering fields will always vary according to the selected data source. Therefore, there are many configuration possibilities.
Some fields have the icon ![]() . You can click on it to check filling instructions.
. You can click on it to check filling instructions.
To make it easier to add filters, check out the main buttons and options displayed below:
 |
Click this button to add filters. In general, the system requires you to fill in one filter, but you can add as many as you need. |
 |
Check this field to determine that one or more indicator filters are made available as global filters for the dashboard. |
| Use this button to delete created filters one by one. |
Step 4: After you fill in the fields, click "Next" to proceed to the second configuration step.
STAGE 2: Grafic Configuration:
In this step, the fields displayed can vary greatly depending on the type of font and the type of indicator you selected in the previous step.
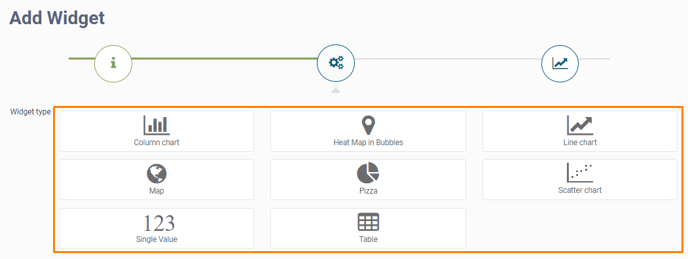
Step 1: You need to set the graphic type. Check the descriptions below to understand which option is best for your purpose. Depending on the source, some types will not be available.
 |
Ideal option to compare values or expose an increasing/decreasing development. |
 |
Good option to analyze whether or not there is a relation between variables, especially when the focus is on intensity. It is best suited for large samples. |
 |
Ideal option when you want to show several series on the graphic. Represents sequences of data on a scale divided into equal periods. |
 |
Ideal option for comparing proportions. |
 |
Ideal option for geographic location representations, presenting information (according to the selected fields) for each point on the map. |
 |
Ideal option for geographic location representations when the objective is to quickly compare aspects such as volume or intensity, for example. |
 |
Ideal option for organizing listings with detailed information. Tables can be exported as Excel, CSV or JSON. |
 |
Ideal option to analyze diverse information related to a single variable. For example, it is possible to create a single value indicator on a fruit, presenting data such as quantity in stock, quantity discarded, quantity sold, inspection notes, etc. |
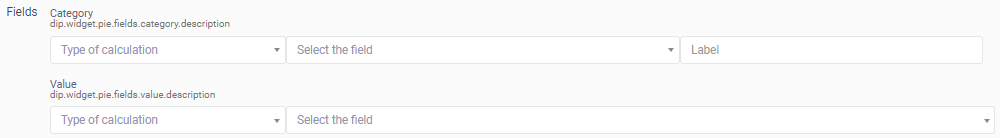
Step 2: The fields displayed after this step vary depending on the selected type. Check the image below for some of the most common possibilities.
|
Select the indicator size relative to your dashboard. |
|
Configure the fields that will be displayed in the widget. |
|
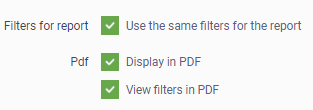
Configure the display of the widget and its filters in the report. |
|
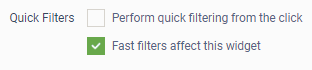
Configure the indicator's filtering possibilities on your dashboard. |

Step 3: On bar or line graphics you can set thresholds. That is, you can insert a fixed line in your graph to identify a goal; or a mean line to highlight a value that will vary with the mean. To do so, check the "Enable Limits" field.
Step 4: In the "Type" field, select the type of line: fixed or average.
Step 5: Fill in the "Label" field to name the line. For landlines, you must also fill in the "Limit" field.
Step 6: Then click on "Add limit".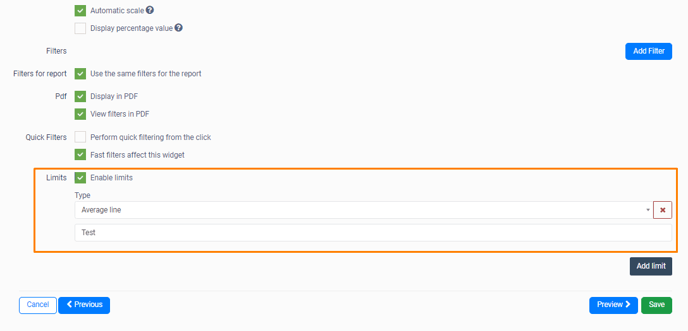
Step 7: After completing these settings, you can click "Preview" to check whether the settings are suitable for you. If everything is ok, click "Save".
If necessary, you can click the "Back" button to return to previous steps and make adjustments.
You can also perform edits after saving your indicator, just enter the dashboard, hover over the widget, click on the button  and select the
  "Edit indicator" option.
To check all customization and editing possibilities, check out our article:
Adding a text indicator
A text indicator is nothing more than a formattable text field where you can add whatever information you want, including links, images and videos. Follow the steps below to add this widget.
Step 1: Within the desired dashboard, click on the "New widget" button and select the "Text" option.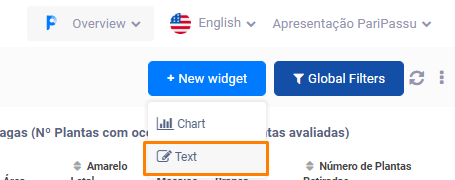
Step 2: Next, include all the content you want in the "Escreva um texto" (means write a text in portuguese) field.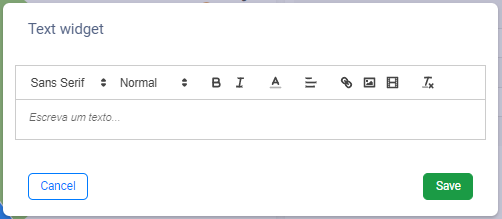
 |
Displays font options for formatting. Select the piece of text you want to format and click this button to choose a different font. |
 |
Features different size options for formatting. Select the piece of text you want to format and click this button to choose between small, normal, large and extra large sizes. |
 |
Formats text in bold. Select the piece of text you want to format and click to bold. |
 |
Formats text in italics. Select the piece of text you want to format and click to apply the effect. |
 |
Allows you to choose a different color for the text. Select the piece of text you want to format, click on the button and then on the desired color. |
 |
Formats text alignment. Select the piece of text you want to format, click the button and choose from the left-aligned options; centralized; right aligned; justified. |
 |
Allows you to create a link in your text. Select the piece of text you want to format, click the button and paste the desired link address into the "Enter link" field. Then click "Save". |
 |
Allows you to include an image in your text widget. Click the button and select the image from your computer. Then click "Open". |
 |
Allows you to include a video in your text widget via a link. Click the button and paste the desired video address into the "Enter video" field. Then click "Save". |
 |
Clears applied formatting. To clear, select the desired text section and click on the button. |
Step 3: After formatting your text, click "Save" and you're done!
If you have any questions, CLICK HERE to contact our Customer Success team! We will be happy to assist you! 🤗💙
See you! 🖐️